
Flight Tracker: Streamlined Career Development Tracking & Analysis
Career development programs, no matter what stage of the academic career they cater to, face similar challenges. A wide range of information about scholars is available, from demographics, publications, and grant submissions to pilot funding, composition of mentor panel, training activities, and career milestones. Much of this data needs to be reported to funding agencies at regular intervals, but is scattered across different public and internal sources.
Enter Flight Tracker. This software allows users to track and understand their scholars’ careers longitudinally via automated data collection. Flight Tracker was developed at Vanderbilt and is now used by 55 institutions in a growing consortium. Programs across the breadth of academic career development use the program, from graduate programs and training grants to departments tracking tenure and promotion and research impact. Data lives securely in a FISMA- and FERPA-compliant REDCap database.
Watch the Flight Tracker intro video.
Flight Tracker collects the following:
- Grants from NIH and Federal RePORTER (and optionally, from the home institution’s own grant management software);
- Publications from PubMed;
- Bibliometrics such as the Relative Citation Ratio and Altmetric;
- Patents from the US Patent Office;
- Demographics, education, honors and awards, job changes, and more via surveys of scholars;
- Custom resource use such as attendance at workshops or online courses;
- Anything else you can dream up.
Flight Tracker uses this data to produce visuals, dashboards, and metrics about your group of scholars. These are just a few of the tools available.
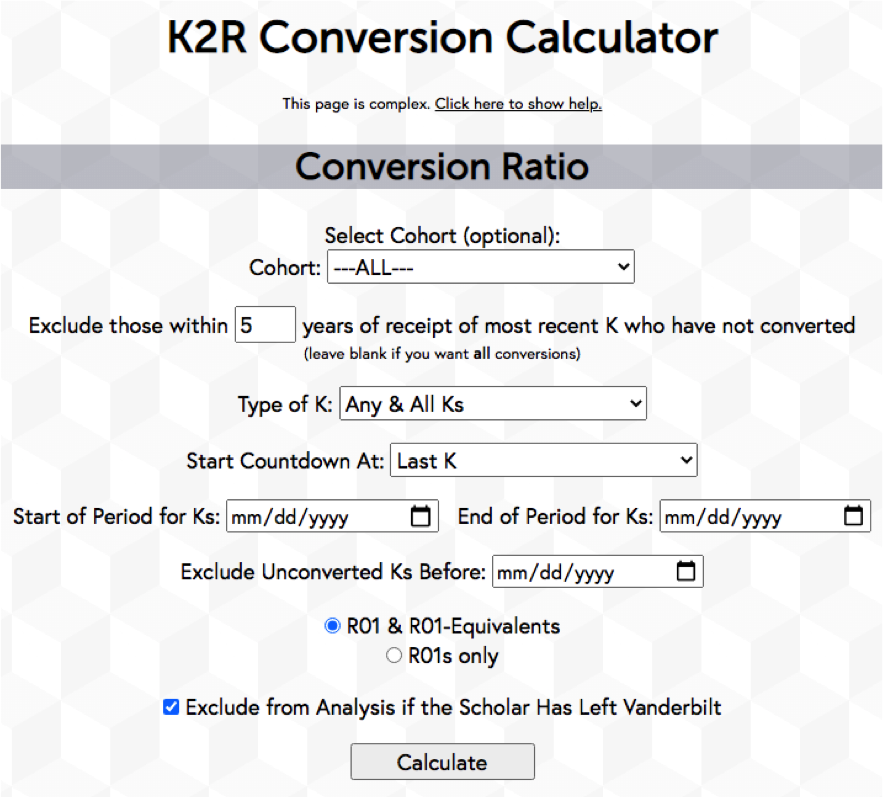 K2R Conversion Calculator
This tool shows the percentage of your scholars who have moved from career development award to research independence. You can slice and dice the group along lines such as gender, degree type, department, or type of career development award, as well as by date ranges. It includes up-to-the-minute data every time you access it.
Social Network Graphs
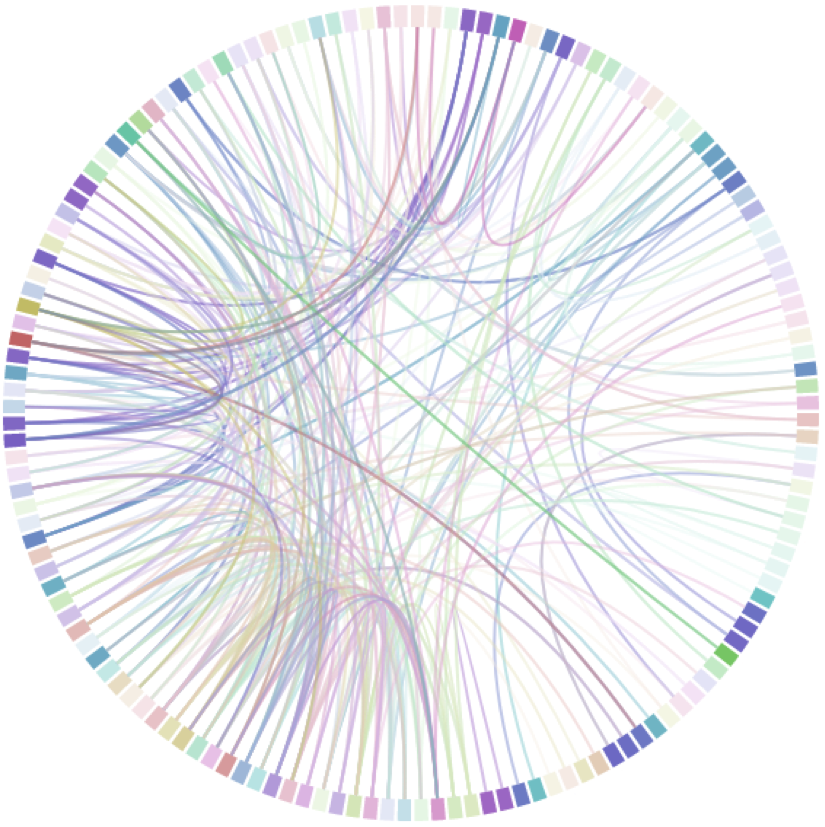 Visually demonstrate relationships between scholars, mentors, and more with chord diagrams. The example to the right is a graph of co-authorship relationships among a subset of career development awardees at Vanderbilt. Each square on the edge of the circle is a person and each line is a publication the connected people have co-authored. These diagrams can also be used to show connections between mentors and mentees, for example if you’d like to show that the participating faculty for your grant have been publishing or writing grants with the former trainees and the applicant pool. Chord diagrams can also help identify interdisciplinary grant teams.
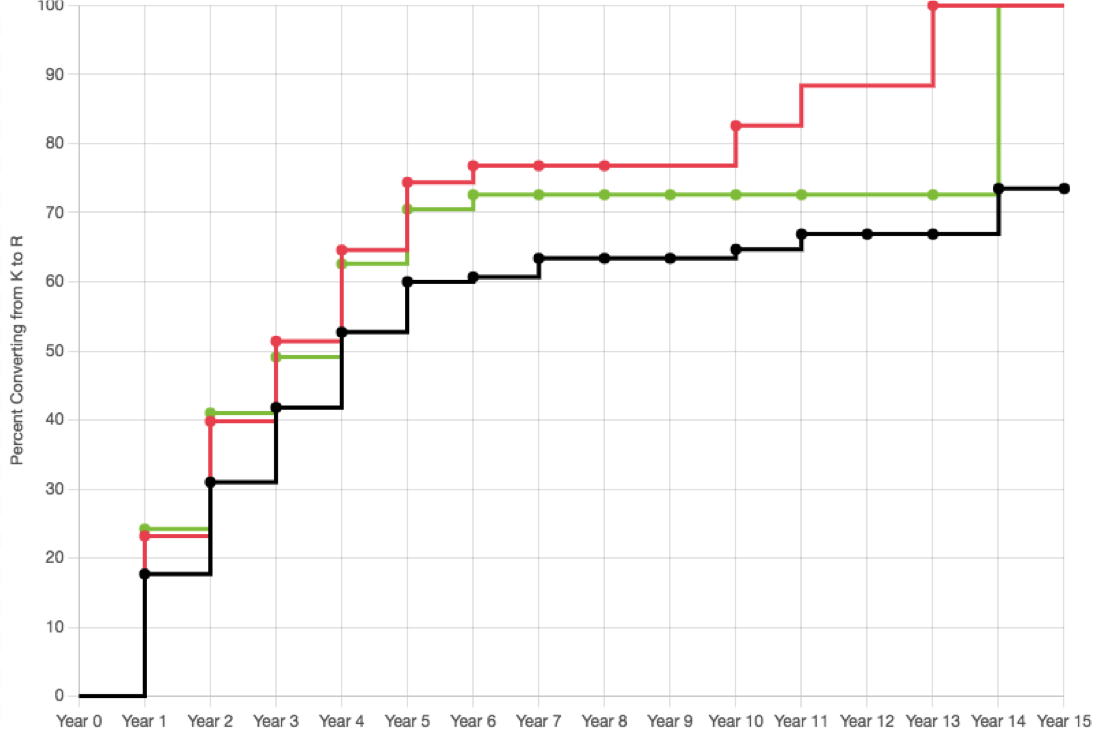 Success Curves
Kaplan-Meier Success Curves provide a breakdown of programmatic elements contributing to your K-to-R conversion. In this example, the black line is the conversion ratio of Vanderbilt career development awardees since 2000, with about 70% converted by fifteen years after the start of their career development award. The orange and green lines show this conversion for subgroups who used key resources like internal study section. Use of these resources confers a 30% increase in successful conversion to independent funding, providing evidence to invest consistently in these programs and encourage participation.
Staff time for Flight Tracker upkeep is generally light. With a large number of scholars, initial effort may be high, but once over the hump, ongoing effort is minimal. For all career development awardees since 2000 at Vanderbilt, which totals approximately 550 scholars, it takes me:
- 2-3 hours a month to assure grants are auto-categorized appropriately as Ks, Rs, etc.;
- 3-4 hours a month to check new publications for problems like another John Smith’s paper being pulled into my John Smith’s profile;
- 30 minutes a month to add new scholars or make updates to existing scholar profiles;
- 2-4 hours per year to set up and monitor annual surveys.
Flight Tracker also saved considerable time with our recent CTSA renewal. With data in the system from surveys and external sources, the software can produce Tables 5 and 8 of the standard NIH reporting tables at the touch of a button. We were also able to include some of the visualizations above in our grant text, as well as quickly access metrics like K-to-R conversion, demographics, and more. Retrieving these numbers before took tedious manual calculation.
To get started with Flight Tracker, ask your local REDCap admin to enable the “Flight Tracker for Scholars External Module” on a REDCap project. The same institution can have multiple projects, e.g., each T32 and K12 can have its own Flight Tracker, or each doctoral program.
You’ll be able to put in a list of names, departments, and resources to start tracking data immediately for your project. After setup, Flight Tracker starts collecting data immediately. Once data is in the system, you can wrangle your initial set of grants and publications for accuracy.
Then, join the club. The Flight Tracker Consortium gets members up to speed and keeps everyone on track with two calls per month: A “newbie” call to help new users get started and a full consortium meeting with updates. Email Scott Pearson to receive invitations to these calls. You can also view our video archive for instructions, tips, and tricks for importing and working with scholar data.
We release updates to Flight Tracker regularly, many based on requests from consortium members. Establish a regular upgrade schedule with your REDCap admin.
More Resources
Writing Your K or CDA Progress Report
Beginner’s Eye for the Science Guy (or Gal)
Get Your PMCIDs PDQ
Want to live on the Edge?
RegisterAbout the Author
Screen Name
About Me
I'm a Senior Program Manager for the Edge at Vanderbilt and primarily work with early career faculty. I manage the Newman Society, the VUMC Faculty Research Scholars program, Edge Reviews, and more. I also edit much of the content on the Edge. When not editing, writing, or working on career development activities, you can find me jumping, spinning, and gliding on the ice.


1 Comment
Glad to join the conversation. Tracking scholars’ career development has always been difficult. This software will be useful.